Without setting a precedent, this time I am going to talk about some userland tools. In particular, I would like to discuss how to catch memory-related runtime bugs with Valgrind and AddressSanitizer (ASan). How come? Because I have mentioned equivalent tools for the Linux kernel in other articles, and I would like to cover them in more detail. But I have noticed that many beginners were completely unaware of any dynamic analysis tool, and that must be fixed immediately.
These tools are almost a must if you code in C/C++, and if you use them wisely, they will save you from rewriting thousands (potentially millions) of lines of C/C++ code in Rust ![]() Believe it or not, that’s not the only way to fix existing code, even if some rustaceans tell you otherwise. Apparently, some sorts of crabs are able to process words like lifetime and trait, but not realistic or overkill…
Believe it or not, that’s not the only way to fix existing code, even if some rustaceans tell you otherwise. Apparently, some sorts of crabs are able to process words like lifetime and trait, but not realistic or overkill…
Content:
- 1. A buggy program
- 2. Attaching Valgrind to a binary
- 3. Faster with (HW)ASan
- 4. Attaching Valgrind to systemd services
- 5. What about undefined behavior, threads, or flow integrity?
- 6. Support for sanitizers in Meson and Qt
1. A buggy program
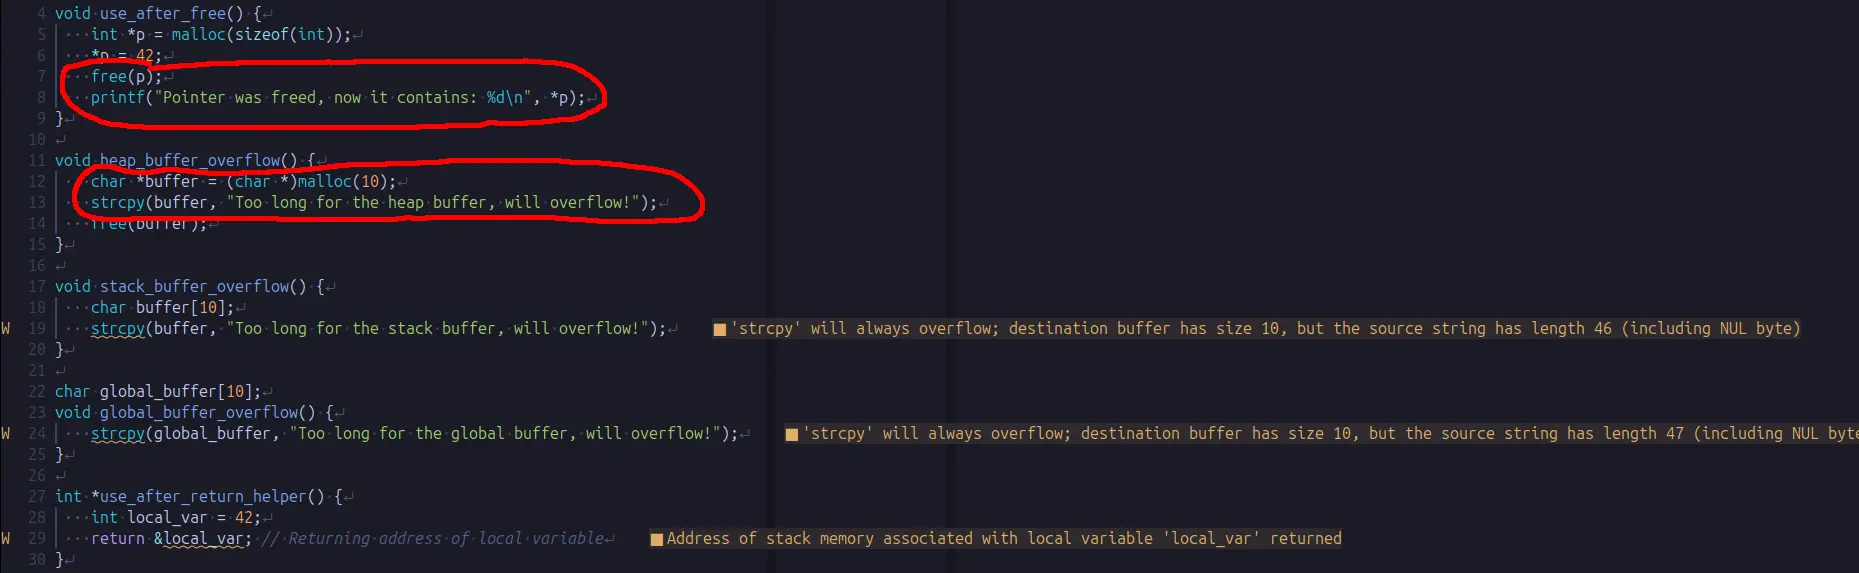
I have prepared this very simple program in C that generates a number of memory-related bugs on demand: use-after-free, buffer overflows, etc. You can use it to trigger the bug you are interested in, and see what the reports look like and what information you can expect. All bugs will be caught by Valgrind/ASan, and it should be easy to apply what you learned to any other program, simple or complex.
Note that the compiler will catch some bugs when you build the binary, but just because they are too obvious. You should get used to look for warnings in the compilation process, but keeping in mind that the compiler is not the most powerful tool to catch bugs, and that is usually not enough. In fact, half of the bugs are not noticed by GCC, and clangd does not find them either.
2. Attaching Valgrind to a binary
Alright, let’s give the program a try! I will use Valgrind first to see if it is able to catch the bugs on the fly. By the way, the ‘valgrind’ package is available in all distros I know, just install it. Valgrind could not be easier to use: valgrind [--args] ./program. It accepts a bunch of arguments, some of them already set to default values that cover the most common use cases (e.g. memcheck as the default tool). You can see the whole list by running valgrind --help.
First, an example without arguments:
# ignore the warnings, we want to have those bugs in the code!
$ gcc -o bug-generator bug-generator.c
$ valgrind ./bug-generator
==16416== Memcheck, a memory error detector
==16416== Copyright (C) 2002-2022, and GNU GPL'd, by Julian Seward et al.
==16416== Using Valgrind-3.22.0 and LibVEX; rerun with -h for copyright info
==16416== Command: ./bug-generator
==16416==

Select a bug to generate:
1. Use after free
2. Heap buffer overflow
3. Stack buffer overflow
4. Global buffer overflow
5. Use after return
6. Use after scope
7. Use uninitialized
8. 1000 memory leaks
X. Exit
Enter your choice: 8
Done
Valgrind has started tracking our program (whose PID is the number at the beginning of every line). Then the menu is displayed, and I have generated 1000 memory leaks, which is one of the bugs that the compiler did not catch. Valgrind did not complain yet, because the memory will be definitely lost once the program ends. Until then, it will be in use (but already wasted). Let’s end the program and see what happens:
Select a bug to generate:
1. Use after free
2. Heap buffer overflow
3. Stack buffer overflow
4. Global buffer overflow
5. Use after return
6. Use after scope
7. Use uninitialized
8. 1000 memory leaks
X. Exit
Enter your choice: X
==16416==
==16416== HEAP SUMMARY:
==16416==     in use at exit: 4,000 bytes in 1,000 blocks
==16416==   total heap usage: 1,002 allocs, 2 frees, 6,048 bytes allocated
==16416==
==16416== LEAK SUMMARY:
==16416==    definitely lost: 4,000 bytes in 1,000 blocks
==16416==    indirectly lost: 0 bytes in 0 blocks
==16416==      possibly lost: 0 bytes in 0 blocks
==16416==    still reachable: 0 bytes in 0 blocks
==16416==         suppressed: 0 bytes in 0 blocks
==16416== Rerun with --leak-check=full to see details of leaked memory
==16416==
==16416== For lists of detected and suppressed errors, rerun with: -s
==16416== ERROR SUMMARY: 0 errors from 0 contexts (suppressed: 0 from 0)
Once we program ended, Valgrind generated a report where we can see that some memory was leaked. In this case, 4000 bytes were leaked. That matches 1000 times the size of an int, which is exactly what the program allocated. As the whole allocation was not carried out at once, we have 1000 tiny blocks of wasted memory. On the other hand, the report does not give much more information: good to know that there is a memory leak, but you usually want to know where. Actually, Valgrind did not even treat the memory leak as an error. But Valgrind can do better than that, and the report gave us a hint: Rerun with –leak-check=full to see details of leaked memory. Let’s try that:
==21198== HEAP SUMMARY:
==21198==     in use at exit: 4,000 bytes in 1,000 blocks
==21198==   total heap usage: 1,002 allocs, 2 frees, 6,048 bytes allocated
==21198==
==21198== 4,000 bytes in 1,000 blocks are definitely lost in loss record 1 of 1
==21198==    at 0x4846828: malloc (in /usr/libexec/valgrind/vgpreload_memcheck-amd64-linux.so)
==21198==    by 0x1094C1: memory_leak (in /home/jc/test/bug-generator)
==21198==    by 0x109655: main (in /home/jc/test/bug-generator)
==21198==
==21198== LEAK SUMMARY:
==21198==    definitely lost: 4,000 bytes in 1,000 blocks
==21198==    indirectly lost: 0 bytes in 0 blocks
==21198==      possibly lost: 0 bytes in 0 blocks
==21198==    still reachable: 0 bytes in 0 blocks
==21198==         suppressed: 0 bytes in 0 blocks
==21198==
==21198== For lists of detected and suppressed errors, rerun with: -s
==21198== ERROR SUMMARY: 1 errors from 1 contexts (suppressed: 0 from 0)
This time the memory leak is an error, and we even got a backtrace that we could use to find the bug. Unfortunately, the line numbers are not displayed. Why? Because the program was not built with debug symbols. That will usually be the case in production, and you will have to make the most of what you get from Valgrind. We are not in production, so let’s add debug symbols and run the same test again:
$ gcc -g -o bug-generator bug-generator.c
The new backtrace looks like this:
==21898== 4,000 bytes in 1,000 blocks are definitely lost in loss record 1 of 1
==21898==    at 0x4846828: malloc (in /usr/libexec/valgrind/vgpreload_memcheck-amd64-linux.so)
==21898==    by 0x1094C1: memory_leak (bug-generator.c:53)
==21898==    by 0x109655: main (bug-generator.c:99)
The memory allocation happened in line 53 within memory_leak(), and it was never freed.
3. Faster with (HW)ASan
That’s all great, but if you can re-compile the program (often you can’t or don’t want to), you could use ASan instead of Valgrind. Why would you do that? Because Valgrind heavily affects runtime, and according to the Valgrind documentation, some programs could run up to 30 times slower. According to its own documentation, the average slowdown of the program due to ASan is around 2x. That is very convenient when your program needs to meet some timing constraints. For example, I have used both Valgrind and ASan to analyze more complex programs with Gstreamer video pipelines, and with Valgrind I was limited to ~4 frames per second. On the other hand, I could easily reach 30 fps with ASan.
In order to run our program with ASan, you don’t need to install anything unless you are using an incredibly old compiler (LLVM < 3.1 or GCC < 4.8). You simply have to compile the program with a new argument: -fsanitize=address.
$ gcc -g -fsanitize=address -o bug-generator bug-generator.c
$ ./bug-generator
This time you can execute the program alone, and after running the same test and finishing the program, you will get a report like this one:
=================================================================
==35553==ERROR: LeakSanitizer: detected memory leaks

Direct leak of 4000 byte(s) in 1000 object(s) allocated from:
    #0 0x7986bbefbb37 in malloc ../../../../src/libsanitizer/asan/asan_malloc_linux.cpp:69
    #1 0x55cad6b98863 in memory_leak /home/jc/test/bug-generator.c:53
    #2 0x55cad6b98acd in main /home/jc/test/bug-generator.c:99
    #3 0x7986bba2a1c9 in __libc_start_call_main ../sysdeps/nptl/libc_start_call_main.h:58
    #4 0x7986bba2a28a in __libc_start_main_impl ../csu/libc-start.c:360
    #5 0x55cad6b98244 in _start (/home/jc/test/bug-generator+0x2244) (BuildId: 2fc43751cfb164be24514984620f6f1b3afa2ce9)

SUMMARY: AddressSanitizer: 4000 byte(s) leaked in 1000 allocation(s).
Pretty much the same, right? And the execution time of the loop dropped from ~8 ms with Valgrind to ~1.6 ms with ASan. 5 times faster, not bad! But it comes at a price: the program size and the memory usage have increased. The former is usually not relevant, but still: the size of a trivial program like the one we are using here went from 19 KB to 33 KB. That might not be an issue on your computer, but a set of much bigger programs running on a tiny embedded system could be a different story.
If your program is running on arm64 (apparently, there is some sort of support for x86_64, but very restricted), you could still try HWASAN (hardware-assisted AddressSanitizer) to reduce memory usage. You only need to pass -fsanitize=hwaddress instead, but as stated in the documentation, it has a couple of drawbacks. Read the documentation carefully to save time when things don’t work as expected.
For the sake of completeness, I cross-compiled the same program for aarch64, and I got the following binary sizes:
-
aarch64-linux-gnu-gcc -g -o bug-generator bug-generator.c: 72 KB -
aarch64-linux-gnu-gcc -g -fsanitize=address -o bug-generator bug-generator.c: 83 KB -
aarch64-linux-gnu-gcc -g -fsanitize=hwaddress -o bug-generator bug-generator.c: 75 KB
The one compiled with -fsanitize=hwaddress is indeed smaller, but in most cases that reduction will be negligible. On the other hand, the RAM requirements are apparently the real gain. I have tested both programs multiple times on a Raspberry Pi, and the results were consistent and promising:

I am going to ignore the fact that the binary for arm64 is way bigger than the one for x86_64 with the arguments I passed, because that is out of the scope of this article. ABIs, compiler optimizations… stuff for another article! If you are interested in this topic, I would recommend you to run the same experiment with clang (the original target for ASan) instead of gcc… a couple of surprises are waiting for you ![]()
Valgrind currently supports more architectures than ASan. On some architectures you will have no choice, no matter if you can re-compile the program or not. Moreover, Valgrind not only offers debuggers, but also multiple profiling tools. Believe me, Valgrind is a really awesome, yet ofter underutilized tool suite!
4. Attaching Valgrind to systemd services
Usually you won’t run your program manually, and especially in embedded systems, it will probably be run as a systemd service. In that case, attaching Valgrind to it is still very simple. You just have to find the .service file that references the binary to be executed, and add valgrind to the ExecStart line:
# Before:
# ExecStart=$YOUR_PATH_TO_THE_BINARY/$YOUR_BINARY
# After:
ExecStart=valgrind $YOUR_PATH_TO_THE_BINARY/$YOUR_BINARY
Then you will have to reload the service file, and restart the service:
systemctl daemon-reload
systemctl restart $YOUR_SERVICE
You can stop it by simply calling systemctl stop $YOUR_SERVICE, and journalctl will show you the Valgrind report. Basically the same we did before, but with systemd stuff in between.
If you are using ASan, you don’t have to modify the service file because it is already running within the program. Just restart the service, and let it pick the re-compiled binary.
5. What about undefined behavior, threads, or flow integrity?
I have restricted this article to address sanitizers, but there are so many others that this article could have become a book to cover them all. Now that you know how they work, using a different one (or several at the same time, if they are compatible) is as simple as editing the arguments you pass to Valgrind or the compiler.
There is almost a sanitizer for every kind of bug/security issue you could imagine, and new sanitizers appear every now and then. But some of them are widely used, and you should at least know that they exist (and probably use them regularly!). Here’s a short list with a few sanitizers you could use to instrument your code:
-
Thread Sanitizer:
-fsanitize=thread, for data races. By the way, Valgrind also offers two thread debuggers: Helgrind and DRD. -
Memory Sanitizer (MSan):
-fsanitize=memory, for uninitialized values. -
Undefined Behavior (UBSan):
-fsanitize=undefined, for… yeah, undefined behavior, like dividing by zero. -
Control Flow Integrity (CFI):
-fsanitize=cfi, to abort the program if vulnerabilities that could be used to modify the program’s control flow are found.
If you want to learn more about those sanitizers, and some others, please refer to the official Clang and Valgrind documentation, so I don’t have to reinvent the wheel.
6. Support for sanitizers in Meson and Qt
In order to ease and enforce their usage, many tools have integrated support for sanitizers, so you can use their own configuration variables to include them in your applications. I will just mention Qt and Meson because they are widely used in embedded systems, and I have used them lately, so I can confirm that the code can be instrumented very easily. But I am pretty sure that you will find similar approaches within many other common tools.
-
To instrument your Qt applications, pass the required flags (
sanitizerand then the list of sanitizers) to theCONFIGvariable, usually within a .pro file. For example, you could include and the thread sanitizer and UBSan as follows:CONFIG += sanitizer sanitize_thread sanitize_undefined -
Meson provides the
b_sanitizebase option (e.g.-Db_sanitize=undefinedfor UBSAn), and of course you could pass the-fsanitizeargument “manually” with something likeadd_project_arguments('-fsanitize=undefined', language: 'c')for UBSan in a C project.
As you can see, the only excuse you really have to refuse using sanitizers is laziness. And if you still decide not to use them, don’t complain the next time you find yourself looking for a needle in a haystack!
Enjoy and share knowledge!